
Contact
DMT Petrologic GmbH & Co. KG
Karl-Wiechert-Allee 76
30625 Hannover, Germany
Phone: +49 511 5413917
E-Mail: info dmtpetrologic.com
AVO
Amplitude vs. Offset
Amplitude-versus-Offset (AVO) methods analyze the reflection behavior with increasing incident angle or offset at layer boundaries. The partitioning of energy depends on the P- and S-wave velocities which vary according to the amount of hydrocarbons present. The data preparation for AVO analysis is extremely important. The presence of noise, whether coherent or random, has a negative effect on AVO analysis. Amplitude scaling processes such as AGC may in fact reduce the noise, but they destroy the real amplitude relationships of the data and are thus not acceptable. Surface consistent processing together with residual amplitude decay and residual nmo analysis contribute towards a robuster AVO result.
The AVO results can be complemented here in Hannover by the calculation of AVO response curves, AVO modeling (Hampson & Russell). Furthermore we offer here acoustic and elastic inversion as well as the seismic attributes computation through our cooperation with Rock Solid Images.
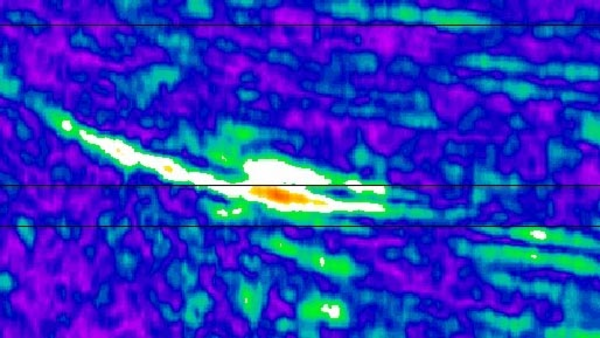
- The amplitude envelope of a far-near (angle or offset) section provides a quick indication of AVO effects in the data.

- AVO crossplots are particularly useful for analyzing trends. Changes in the composition of porous rocks (eg. gas or oil replacing brine) produce a deviation from the background trend. AVO methods attempt to find and classify these anomalies and provide a statement about their validity as a prospect. Several useful crossplots provide clues as to the presence of hydrocarbons:
- AVO intercept vs gradient
- P-wave vs S-wave impedance
- P-wave impedance vs (Vs/Vp)
- Lambda*rho vs Mu*rho
- Acoustic impedance vs poisson's ratio
- Smith & Gidlow (1987) using an amplitude weighted summing method of the reflection amplitudes to determine the P- and S-reflectivity. Their fluid factor is another way of indicating the presence of hydrocarbons. Deviations from the "mudrock-line", which basically represents the regional Vp/Vs trend, may be caused by the presence of hydrocarbons.
This is a powerful indicator for reconnaissance AVO investigations in areas with limited well control.
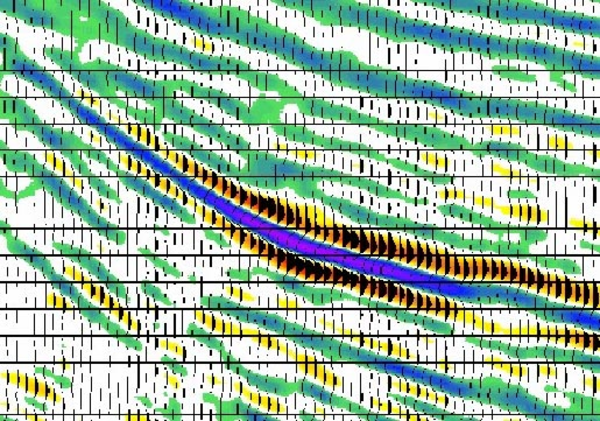
Goodway (1997) extended this and showed that it is then possible to compute elastic parameters such as Lambda (incompressibility)and Mu (rigidity) . The Lambda reflectivity (right) is a pore fluid indicator which can clarify the identification of reservoirs by separating pore fluid effects from lithology effects.